|
|
|
Windows Server 2003 processes are viewable through a surprisingly simple yet informative set of graphical utilities. Using the Task Manager (with three equally helpful screens), the Event Viewer, the Services Manager, and the Resource-Kit-based Process Viewer, a system administrator can review and govern many of the process-oriented activities of the local server. The Task Manager can also rapidly address many performance issues. These tools effectively manage a robust process-oriented, multitasking, and multithreading operating system.
After reviewing this section, a system administrator should have sufficient baseline information to do the following:
Understand Windows Server 2003 processes, threads, pipes, and handles.
Use the Task Manager and Services Manager to identify, start, and kill processes.
Use the Event Viewer to diagnose process success and failure.
Employ the Process Viewer to ascertain priorities.
Schedule processes.
A Windows Server 2003 process is an executable that flows through a logical sequence of events until the appointed action is complete. Technically, an executable program is composed of the base code and related data, a dedicated memory address space, defined system resources, and at least one thread. A thread is the portion of the process being executed. It has a unique identification, its client ID, and a register that defines its microprocessor state. Every thread maintains reserved memory stacks for the execution in the user and kernel modes. It also has storage memory for interaction with other applications, DLLs, run-time libraries, and environmental subsystems.
Processes use threads to invoke an action with a reaction, pipes to connect threads, and semaphores to synchronize activities. Unlike UNIX processes, which involve exec/fork replication and parent/child relationships, Windows Server 2003 utilizes handles. Handles are assigned to threads and identify resources such as a Registry key used for access by a program. (Handles are also applied to events, semaphores, pipes, processes, and communications.)
A Windows Server 2003 process is treated as an object. As such it has a number of characteristics, including a virtual memory address, defined resources, and a security profile. Each process has one or more thread objects associated with its execution. As an object, the thread also has a unique memory stack and system state. The thread is an agent that does the bidding of the process. The Object Manager controls both process and thread objects.
When a new process is created, the CreateProcess() and CreateThread() calls are made. As additional threads are required to support a given process, other CreateThread() calls are invoked. The thread should be thought of as a unit of execution. Between the ends of the thread is a pipe, both ends of which must be open. If either end is broken, the process data is lost.
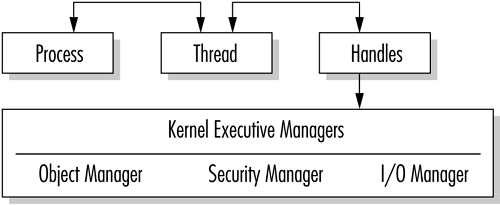
Windows Server 2003 also uses named pipes to transmit information. These pipes are viewed similarly to file objects and operate within the same security framework. A named pipe retains information in memory and dispenses the data as requested by a process. It acts like a regular data file, except that the information is in resident memory, not physically archived on disk. Figure 2.6 illustrates the hierarchy of processes.
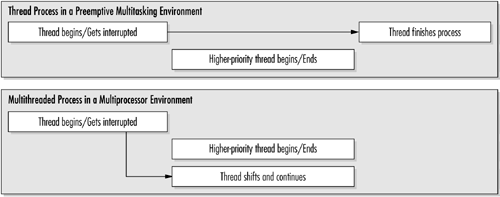
Windows Server 2003 is a multitasking and multithreaded operating system. One of its strengths is its ability to manage and synchronize multiple threads. On a single-processor system, only one thread can execute at a time, but, as a result of context switching, it appears to the user that multiple threads are running. In this scheme (Figure 2.7), a thread executes until it has completed its task, is interrupted by a thread with a higher priority, or waits for system resources. During an interruption, the Windows Server saves the "context" of the thread and reloads it when the CPU is free to continue.
Windows Server 2003 provides a robust process and thread priority facility. The programming API permits the setting of application process priorities, or states, that include idle, normal, high, and real-time; within each of these states two subpriorities can be established. It is important for a programmer to consider the impact of this facility on the entire system. There are 32 priority levels numbered 0 through 31. The first 16 (0�15) are reserved for the user mode, and the remainder are reserved for the kernel mode. After a base priority level is set for a process or a thread, the kernel may dynamically raise it in the event of user interaction. By the same token, the kernel can lower the priority rating for strictly computer-associated operations.
How long a thread is allowed to execute is controlled by a property known as a quantum. A quantum type can be of fixed or variable length. By default, Windows Server 2003 versions give priority to fixed-quanta background services, although Windows XP gives higher priority to applications that generally use variable-length quanta. In theory, these priorities provide greater smoothness to key multitasking functions of the respective environments.
Where processing load is significant, systems with more than one CPU can reduce thread executing wait times. Windows Server 2003 uses symmetric multiprocessing (SMP), which allows user and kernel-mode activities to use any available processor. Symmetric multiprocessor systems have identical processors and functions. (By contrast, an asymmetric multiprocessor system allocates resources to a specific processor even if that CPU is overloaded and others are relatively free.) The clear advantage is the balancing of the processing load across all resources.
With its Internet Information Services, Windows Server 2003 adds two features that make multiuser environments more efficient. The first is processor accounting, which measures the number of processor cycles consumed by Web requests. The second is CPU throttling, which restricts Web applications from overwhelming CPU time. Both are enabled by job objects, which allow the operating system to manage groups of processes as a single unit. The use and administration of process accounting and CPU throttling are discussed in Chapter 16.
Interprocess communication (IPC) and remote procedure call (RPC) are basic to Windows Server 2003. (At the risk of being overly simplistic, RPC can be regarded as the distributed network version of IPC.) Microsoft claims that its implementation of RPC is compliant with Distributing Computing Environment (DCE).
Windows Server 2003 employs a direct relationship between processes and threads. At any given time, there is a producer and a consumer (similar to BSD socket library calls in UNIX). The objective is to achieve a very scalable operating system that permits easy load balancing of discrete measured threads. Windows Servers also employs a FIFO (first-in, first-out) message model.
A Windows Server 2003 service is a special class of process with fixed characteristics. The Component Services Manger is similar to the UNIX daemon in that they perform tasks defined as in either the foreground or the background. They can be managed either locally or remotely (Figure 2.8).
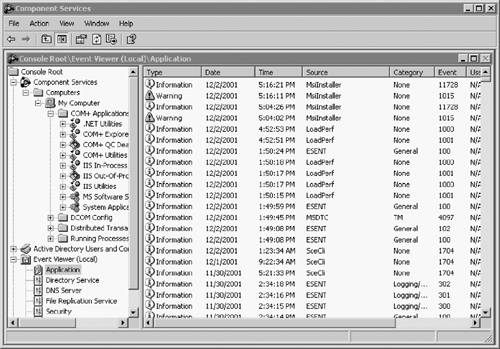
The Windows Server 2003 Component Services Manager provides the list of all defined services, their current status, and their status at startup. These services can be started, stopped, paused, continued, or defined for system startup with a simple mouse click.
To view or change the status of a service, press the Start menu select Programs
select Administrative Tools
select Computer Services. In the left pane, click Services. All defined services on the system will appear in the right pane. Double-click a target service to view its properties. You can make changes or simply view the current status via four tabs: General, Logon, Recovery, and Dependencies.
The Task Manager is a handy system administration tool that provides a snapshot of computer system activity. It is readily available to an administrator at any point during a logon session. The two most common methods of executing the Task Manager are:
Click the right mouse button on the Task bar and select Task Manager.
Press CTRL+ALT+DEL and select Task Manager from the Windows Server Security window.
The Task Manager provides four window tabs for Windows XP and five tabs for Windows Server 2003 and provides very different views of operating system process activities:
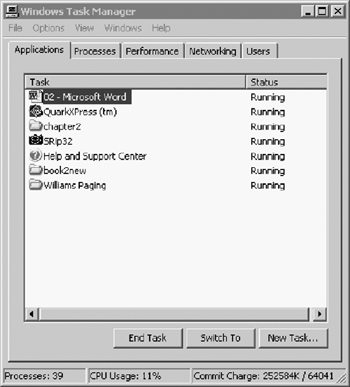
The Applications window permits the view and control of all user-mode applications. Applications may be responsible for one or more processes (Figure 2.9).
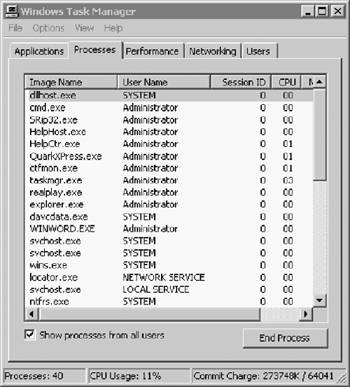
The Processes window provides in-depth information about individual processes, including resource utilization.
The Performance window provides a graphical and numeric view of the system based on the current application and process load.
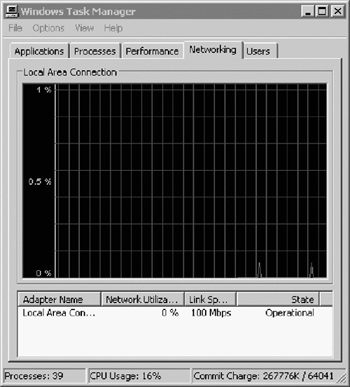
The Networking tab identifies the amount of current network activity on the computer.
The Users tab (Windows Server 2003 only) identifies local users and remote users by name, ID, activity status, and client system name.
A simple dissection of the Applications window shows the application name in the first column followed by the current status. The bottom set of buttons permits the administrator to End Task, Switch to another task, or invoke a New Task. At the bottom of the screen is a system summary status that includes a number of open processes, CPU usage, and memory utilization.
Invoking an application from an icon or command-line instruction ordinarily starts processes. As discussed in a later section, processes can also be initiated through scheduling services like the At utility. The Task Manager can start a new task as well if this option is selected at the bottom of the screen. When New Task is selected, a new dialog box, such as that shown in Figure 2.10, appears.
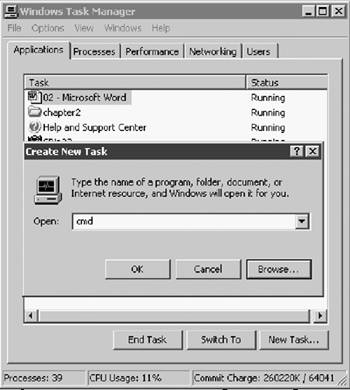
Ordinarily, processes are terminated by the graceful exit of the application through its own kill signals. However, from time to time more radical solutions are required. Processes can be easily killed using the Task Manager. In the Applications window, simply highlight the offending process and select End Task at the bottom of the screen. In the Processes window, select End Process, also at the bottom of the screen. In both cases, a confirming message will appear before termination. At this point, all handles, threads, and pipes are destroyed and data being transmitted is lost.
Figure 2.11 provides a real-time view of network utilization on the local client or server system.
NOTE
Administrators coming from the UNIX environment occasionally face a runaway process known as a zombie. Microsoft claims that zombies will not occur in Windows Server 2003 because its processes do not use the parent/child relationship inherent in UNIX. Each Windows Server process is discrete and independent of the presence or health of a parent. While this may be technically true, certainly some processes (generated by either Microsoft or third-party software) begin sapping very large amounts of memory and become very difficult to kill. Use the Task Manager or the Process Viewer to kill such processes. On rare occasions, you may have to invoke the action more than once.
Early versions of Windows NT supported the UNIX-like utility known as the at command. This command is still supported, but its functions are greatly enhanced by the Task Scheduler. The Task Scheduler and the at command can work together, which is important for older scripts that rely on at. When a task is invoked by the at command, it appears in the list in the Scheduled Tasks window. The Task Scheduler also can use at to run tasks automatically.
The at program is invoked from the CMD command line for single-event scheduling. The at command schedules commands and programs to run on a computer at a specific time and date. The Schedule service must be running to use the at command.
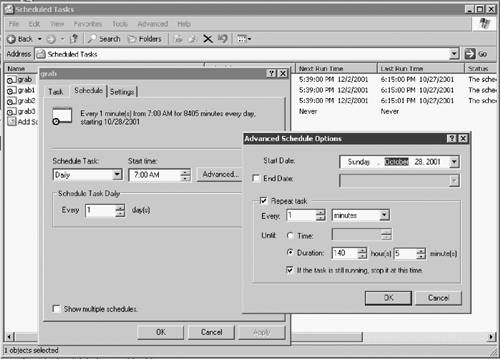
Scheduled Tasks are accessible from Control Panel. The Scheduled Tasks Setup (Figure 2.12) is invoked by double-clicking this icon. Tasks are added by dragging scripts, programs, or documents from Windows Explorer or the desktop to the Scheduled Tasks window. They can also be deleted or modified this way.
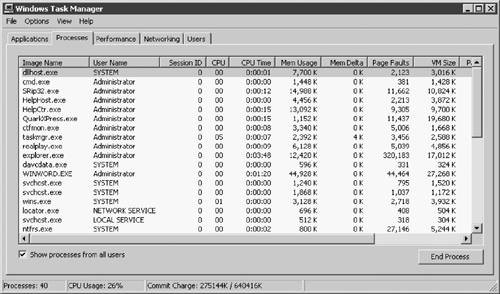
The Processes window provides system administrators with a very good snapshot of their system's activity. Its default screen has five process checkpoints: Image Name, User Name, Session ID, CPU, and MEM Usage (Figure 2.13). A total of 22 items may be selected for analysis by changing Select Columns in the View menu. When the dialog box appears, use the mouse to click the additional reporting parameters. If all options are selected, the system administrator has a reasonably comprehensive view of active processes and their impact on the overall system, as shown in Figure 2.14.
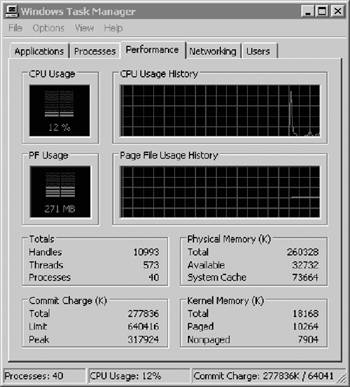
The Task Manager Performance screen (Figure 2.15) displays four graphical representations and four boxes of numeric data for the entire system:
CPU Usage shows current CPU utilization (in this example, the CPU has reached a critical utilization state).
CPU Usage History is a longer-term view generally showing CPU usage over time. Unfortunately, in this window there is no ability to change time intervals or to save or print this information. A tool to refine this view can be accessed by pressing Start Programs
Administrative Tools
Performance.
PF Usage shows utilization based on pagefiles.
PF History shows fluctuation of pagefile usage over time. You can refine this view by pressing Start Programs
Administrative Tools
Performance.
Totals shows the number of open handles, threads, and processes.
Physical Memory summarizes the system memory defined as a total, currently available, and cache available in kilobytes.
Commit Charge shows the total memory allocated to programs, the system limit, and peak memory, including swap memory.
Kernel Memory defines the total memory allocated to kernel-mode activities, broken down by paged and nonpaged events.
New performance tools available with Windows Server 2003 include:
Disk input and output (I/O)
Memory management (e.g., working set management, page fault)
Image load and unload
Process and thread activities such as process create, thread create, and context switching
Registry
Driver delays
Pool allocations
Heap allocations
Central profiling that examines both kernel-mode and user-mode activities
Monitoring processor activity is effectively accomplished by looking at the Process and System object counters. In addition to providing information on utilization, it can pinpoint bottlenecks. The specific items you should examine are:
Processor\% Processor Time for processor usage
Optionally, you can also monitor Processor\% User Time and % Privileged Time along with % Processor Time for more detail
System\Processor Queue Length for bottleneck detection
The Processor\% Processor Time counter is used to gauge the activity of the processor. Look specifically at the counter showing the percentage of elapsed time that a processor is busy executing a non-idle thread.
An examination of processor usage is not straightforward. For example, high processor values could indicate either the efficient handling of a heavy workload or a struggle to keep up. Typically, you will need to understand which applications cause peak processor loads such as software that involves heavy computations. When these applications are churning, anticipate peak loads. If this becomes a problem that impacts other applications, then workload scheduling is appropriate. By contrast, if the processor is peaking because many clients are using the system, then consider adding system resources or offloading some users to another system.
A processor bottleneck simply occurs when too many threads place demands on the processor. A processor queue develops as the threads back up. CPU-bound applications and driver components are notorious for creating bottlenecks. The System\Processor Queue Length counter is used to determine the existence of bottlenecks. A queue of two or more items indicates a bottleneck over time (a snapshot of a number higher than 4 should also be considered a critical bottleneck number.) When this occurs, you have only a couple of options. From a hardware perspective, you can get a faster processor or add a processor. Alternatively, you can restrict application and user activity.
Interrupt activities can also cause a bottleneck. The Processor\Interrupts/sec counter measures the rate of service requests from I/O devices. An increase of the counter value without a corresponding jump in system activity suggests a hardware problem. The Processor\% Interrupt Time is also a modestly good indicator of the interrupt activity of disk drivers, network adapters, and other devices.
NOTE
Windows Server 2003 has new Performance security groups. Members of the Performance Monitor Users group can monitor performance counters on the server locally and from remote clients. Members of the Performance Log Users group can manage performance counters, logs, and alerts on the server locally and from remote clients. These features permit the delegation of responsibilities without granting full administrative rights.
Windows Server 2003 allows administrators to collect performance counter data for a group of servers. All performance objects, counters, and instances can be utilized.
The select multiple objects in Performance Monitor (PerfMon) permit visualization and analysis of performance data. Specifically, this feature supports log monitoring and alerts services. To invoke this feature: Start Control Panel
Performance and Maintenance
Administrative Tools
Performance
System Monitor.
It is important to note that this feature is not available in SysMon for real-time monitors because there is too much data.
Windows Server 2003 adds performance control command-line tools. They include functions that provide management of the control performance counter, event trace log scheduling, and collection and analysis on local and remote computers. These functions are accomplished without the need for the System Monitor (Sysmon) UI. The new tools and the functions they allow managers to perform are:
Logman� Start, stop, query, and schedule performance data and event trace log collection.
Relog� Given specified intervals, sample performance counter logs to extract specific counters and write to a new log file in a different format.
Tracerpt� Report and analyze process kernel, Active Directory, and other transaction-based trace event logs.
Typeperf� Write performance data to the command line every "n" samples.
These command-line tools are available by typing the command in the command prompt window.
The Event Viewer provides a defined log for both normal and abnormal system events. It can be one of the most valuable system administrative tools for troubleshooting problems. A regular analysis of these logs should be undertaken if system problems are suspected.
In Windows an event is any system occurrence that requires notification. One type of event recorded in the Event Viewer system log is a dysfunctional driver or load failure (Figure 2.16). The Source column identifies the application that initiated the message. The Category classifies the event as being related to security, object access, logon/logoff, detail tracking, system, policy changes, account management, and miscellaneous (none).
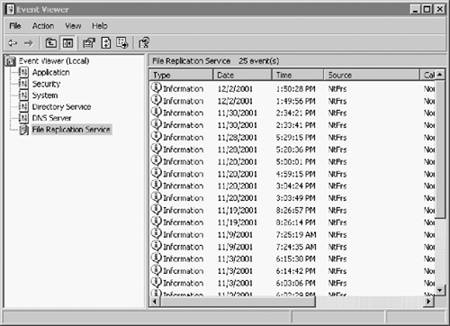
The level of importance of an event message is shown as an icon in the extreme left column: Error, Informational, Warning, Success Audit, and Failure Audit. This application can be launched from the Event Viewer for the local system by clicking the Start menu selecting Run
typing eventvwr
clicking Enter. Alternatively, the Event Viewer is available from Administrative Tools.
The Event Viewer has a very flexible set of options that permits long-term tracking of system, security, and application problems. These options are described in Table 2.1.
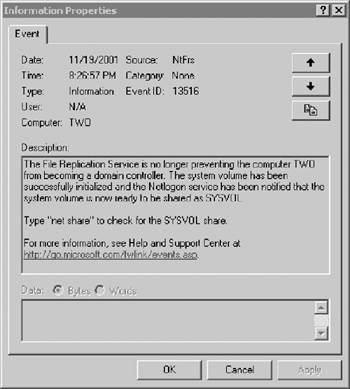
To review details, highlight the item in the right detail panel and double-click. The appropriate event properties window will then be displayed for analysis and action. As seen in Figure 2.17, a significant amount of information is provided to permit zeroing in on the precise location of the event. If a warning or error occurs, appropriate action can then be taken.
|
Option |
Description |
|---|---|
|
Logging |
Rolls events as needed; removes events after a defined number of days; prohibits overwriting of events (requires manual event removal). |
|
Sorting |
Sorts events based on categories, sources, user, or machine. |
|
Archiving |
Saves event records in native Event format (*.EVT) or in normal or comma-delimited ASCII text (*.TXT) format. |
|
Details |
Provides additional information on the event. |
|
Filtering |
Filters desired events or characteristics. |
|
Find |
Locates events based on type, category, source, computer, or other criteria. |
NOTE
In Windows 2000, the Event Viewer feature was introduced that allowed Event Log error messages to manually add hyperlinks to Web sites by changing .RC and .MC files. Windows Server 2003 automatically adds a standard phrase and a Uniform Resource Locator (URL) to each message with the message properties dialog initialization. In addition, an optional string value can be added to the registry to specify the target URL.
NOTE
System logs are essential to system performance analysis. Windows Server 2003 provides the generation of Perf Logs to the size of 1 GB. With a new file format, these logs can be appended to an existing log file.
|
|
| Top |